Visualizations and Tools
eyeCode by Michael Hansen
A Python library for analyzing gaze data of programmers
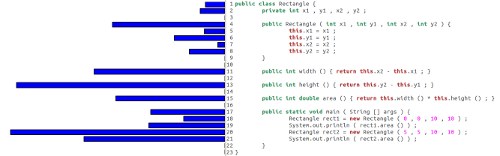
Figure 1: Fixations per line – aggregated
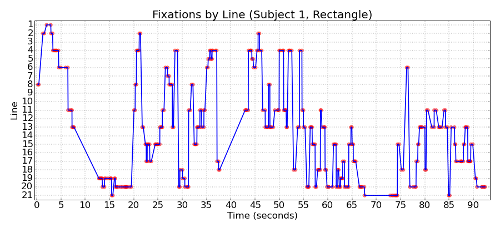
Figure 2: Fixations per line – over time
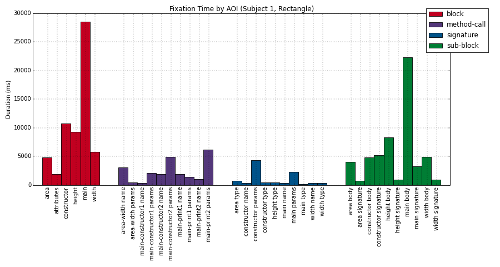
Figure 3: Fixation time per AOI
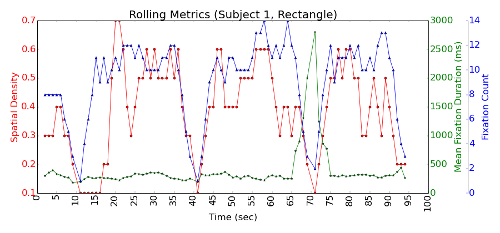
Figure 4: Rolling Metrics
Further examples:
http://eyecode.synesthesiam.com/stories/koli-calling.html
http://eyecode.synesthesiam.com/stories/busjahn_2013/?id=8
Software:
https://github.com/synesthesiam/eyecode
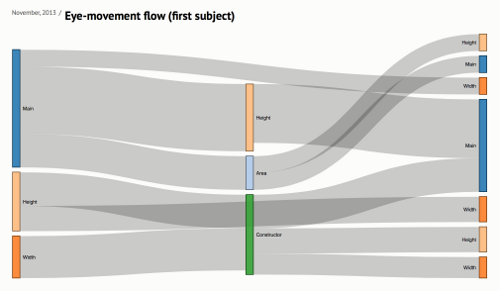
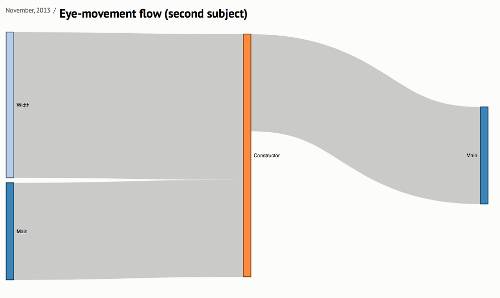
Flow charts by Galina Shchekotova and Maria Antropova
These flow charts are made using d3.js library and represents subject’s switching behavior between different parts of code. This kind of charts could be useful in analysis of subject’s pattern behavior during eye-movement research.
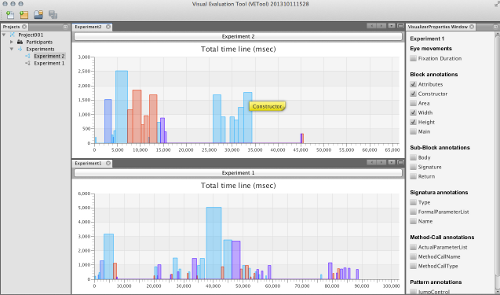
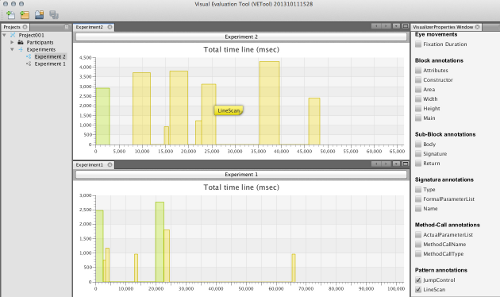
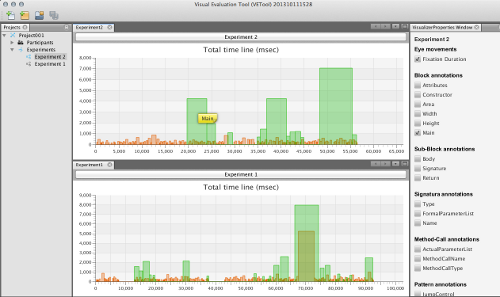
VETool von Paul Orlov
Software Visual Evaluation Tool (VETool) was developed for visual evaluation of eye-tracking data.
https://bitbucket.org/orlovpa/visual-evaluation-tool-vetool